How to Conduct a Simple Air Quality Experiment + FREE Printables
Looking for a simple way to visualize air quality with your kids? Try this science experiment with free printables written in English and Spanish that can be done at home or in a classroom to engage your learners in STEM and bring attention to local air pollution issues.
What is Air Quality and How is it Measured?
Air quality refers to the level of pollutants present in the air. These pollutants can be gases, particulate matter, and biological molecules that can have harmful effects on human health and the environment.
Air quality is typically measured using a network of monitoring stations that collect data on a range of pollutants, such as nitrogen oxides, sulfur dioxide, ozone, particulate matter, and carbon monoxide. These monitoring stations use a variety of instruments and techniques to measure the concentration of these pollutants in the air.
Examining Air Quality with Kids: A Science Experiment
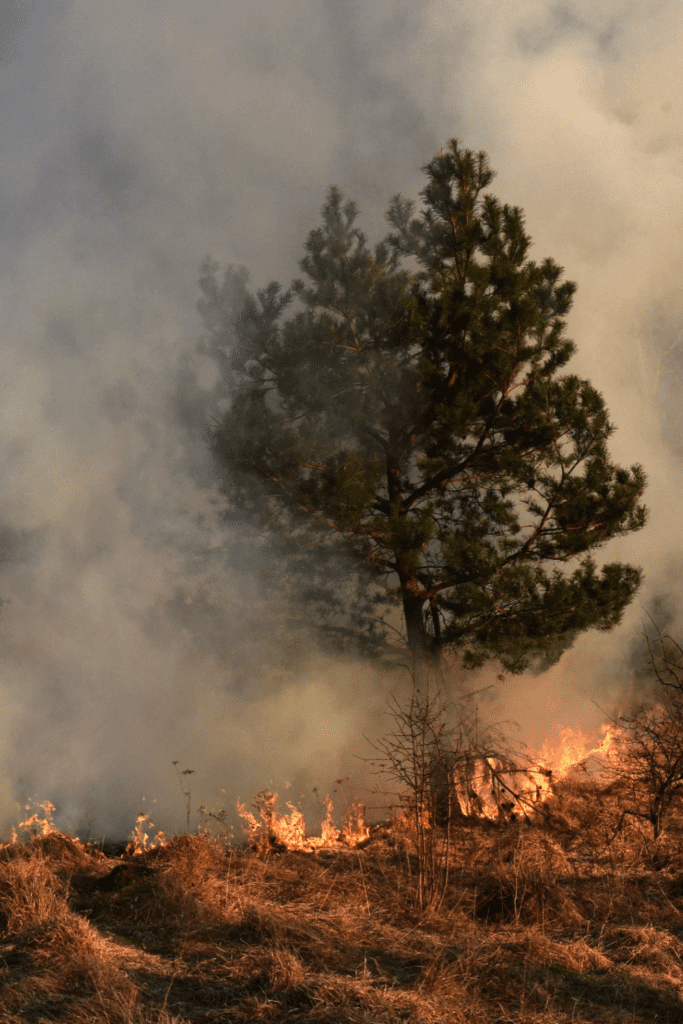
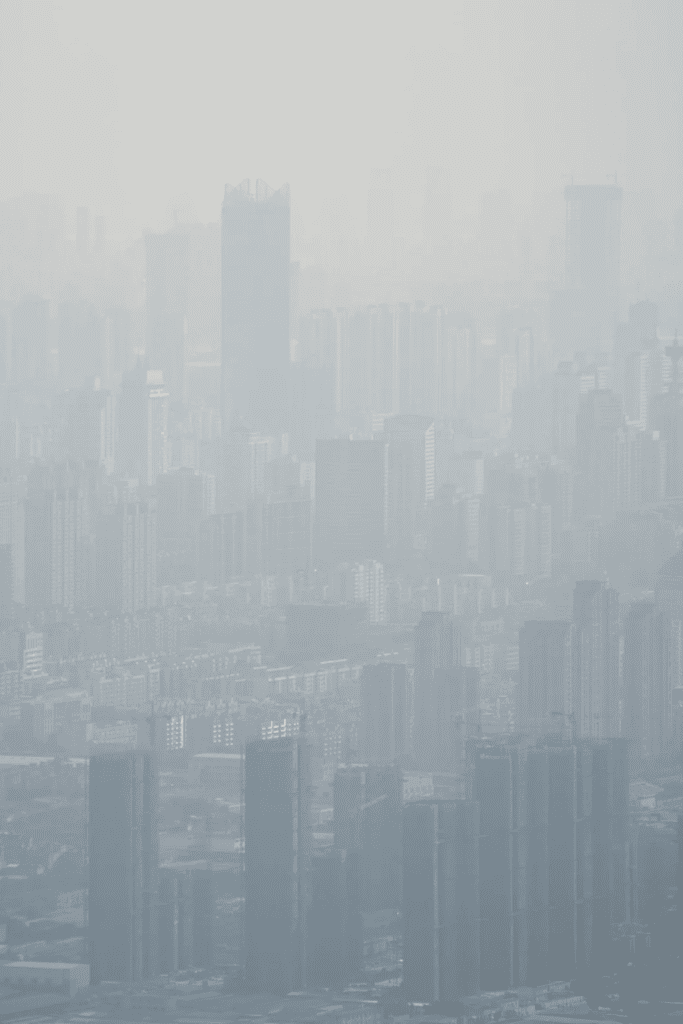
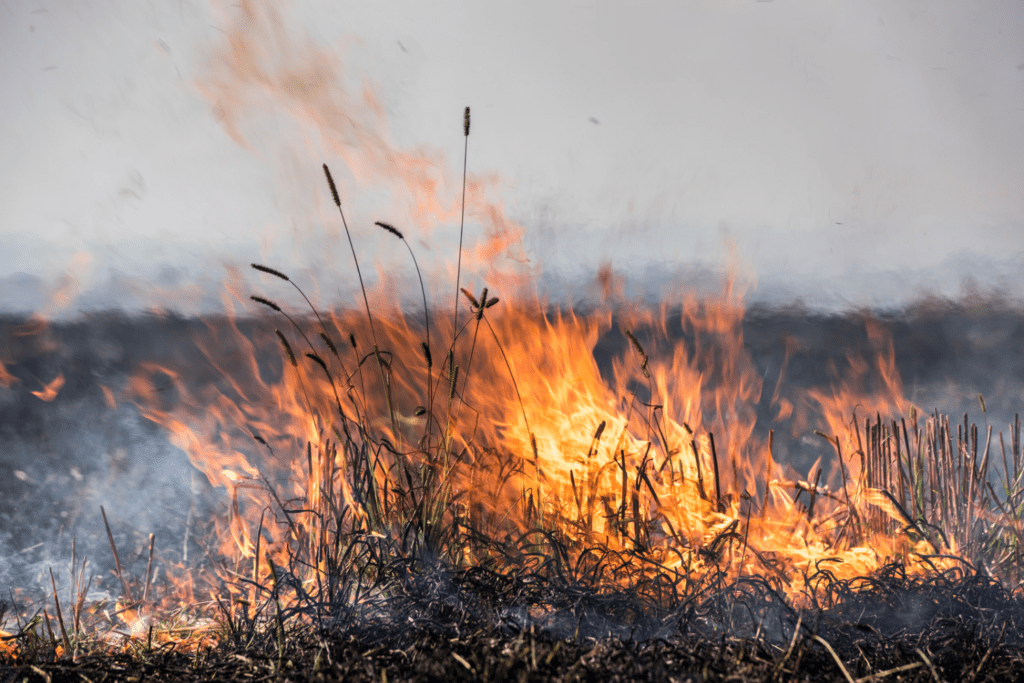
A few years ago, when wildfires were ravaging the West Coast of the United States, I decided to conduct a simple at-home air quality experiment in an effort to explain to my kids what the term “air quality” meant. I also wanted to show them the amount of particulate matter in the air, and how the amount of “dirt” varies from one location to the next.
I asked a group of parents, educators, and friends from across the U.S. to join me in this experiment, in order to compare our results to those from other parts of the country.
Free Ways to Find the Materials Needed for the Air Quality Experiment
In a continued effort to conduct science experiments as sustainably as possible, I recommend you try the following steps to collect the materials you need, prior to purchasing them new.
Ask Your Friends, Family, and Neighbors
Did your grandmother ever tell you a story about how she went to the neighbor’s house to borrow a cup of sugar? As the pace of our modern lives has increased, we have forgotten or have never known what it’s like to walk across the street to ask to borrow something. Capitalize on the kindness of your neighbors, family members, and friends, and revitalize the simple act of borrowing!
Shop Your Local Buy Nothing Group or Facebook Marketplace
If you’re missing some materials to conduct the air quality experiment, consider putting a request on your local Buy Nothing Group or Facebook Marketplace. You’ll be amazed at how quickly your request is met by others looking to declutter their homes! Another option is to stop into your local secondhand or consignment shop and see what items they have available. I have successfully shopped secondhand for science experiment materials more times than I can count.
Check With Your Local Library
Libraries are for borrowing much more than just books! My local library continually hosts children’s activities and crafting sessions. Put a request into your librarian for extra supplies they may have left over from a workshop. My good friend Jen, editor of Honestly Modern, has written an entire series based on ways you can capitalize on your local libraries’ resources.
Materials Needed for the Air Quality Experiment
Here is a list of supplies you’ll need to do this simple disappearing paper science experiment:
- White card-stock, poster board, paper plate or index card
- Scissors
- Hole punch
- String
- Marker
- Ruler
- Petroleum jelly, solid coconut oil, lip balm or clear packing tape
- Magnifying glass
- Air Quality Experiment printable in English or Spanish
Instructions to Conduct the Air Quality Science Experiment
Follow these simple instructions to set-up and monitor the indoor and outdoor air quality of your learning space.
- Cut 2 three inch (7.6 cm) squares from the white card stock.
- Punch a hole in the top of each square.
- Run a string through each hole.
- Cover one side of each paper square with petroleum jelly/coconut oil.
- Take a “before” picture of each paper square.
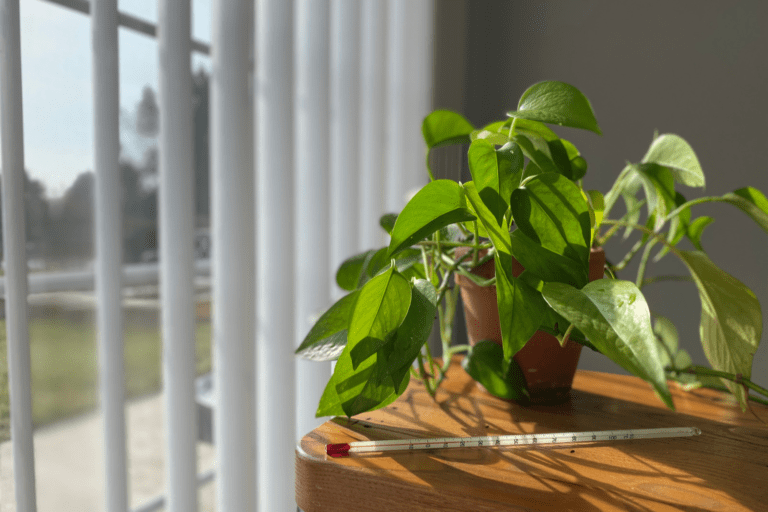
- Hang one square inside, and the other square outside, for 5 days.
- After 5 days, take an “after” picture of each square.
- Compare both squares using a magnifying glass to estimate the total number of particles present.
- Record findings on the Air Quality Experiment printable.
Video Tutorial of the Air Quality Science Experiment
Here is a quick video tutorial to walk you and your learners through the simple steps to set up the air quality science experiment.
Explaining the Data We Collected: A Teachable Example
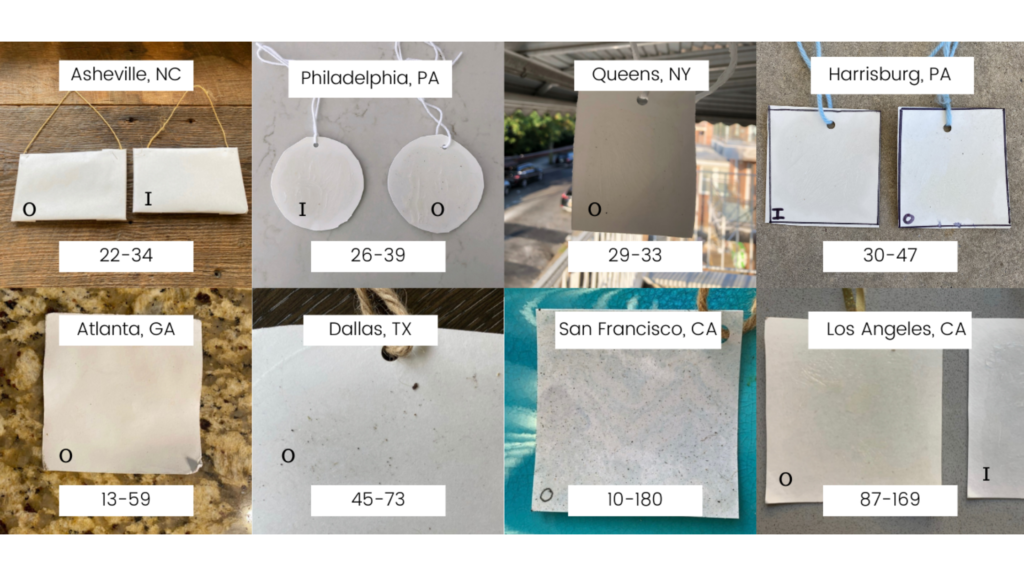
When my family and I conducted this experiment, we had seven other families participate with us. Eight locations were sampled for 5 days, during the week of September 14th, 2020, and the air quality index (A.Q.I.) range for each location was recorded, based on the data reported by AirNow.gov.
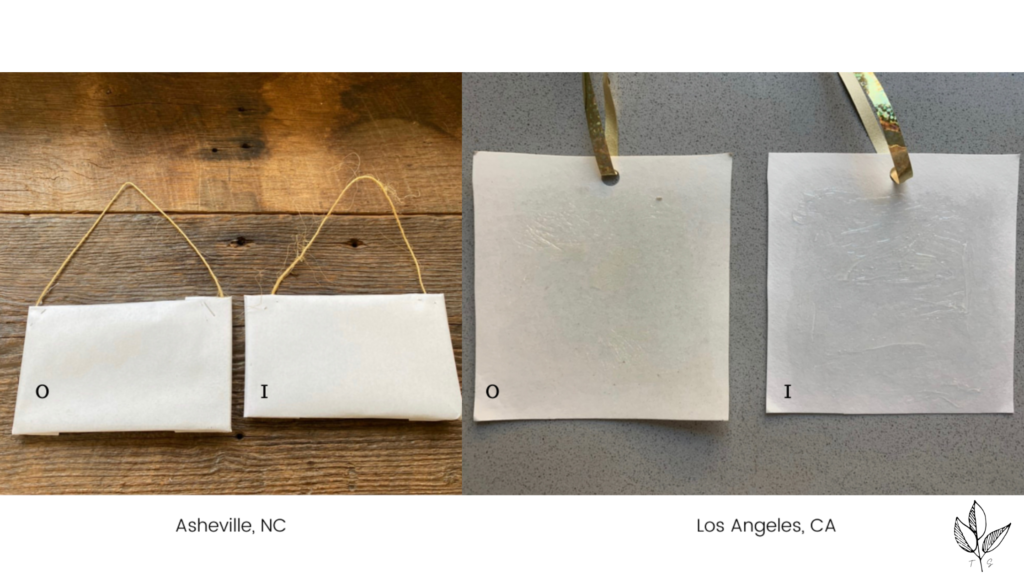
Samples taken inside are labeled with an “I” and samples taken outside are labeled with an “O”.
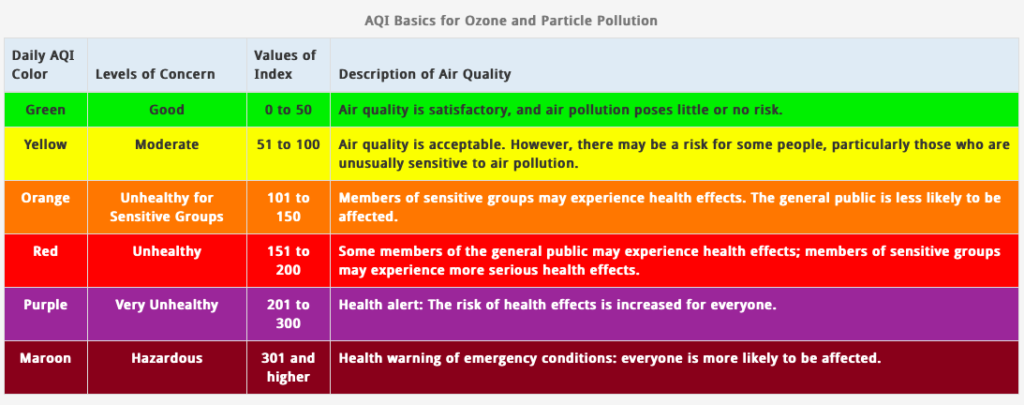
Understanding How Air Quality is Measured in the U.S.
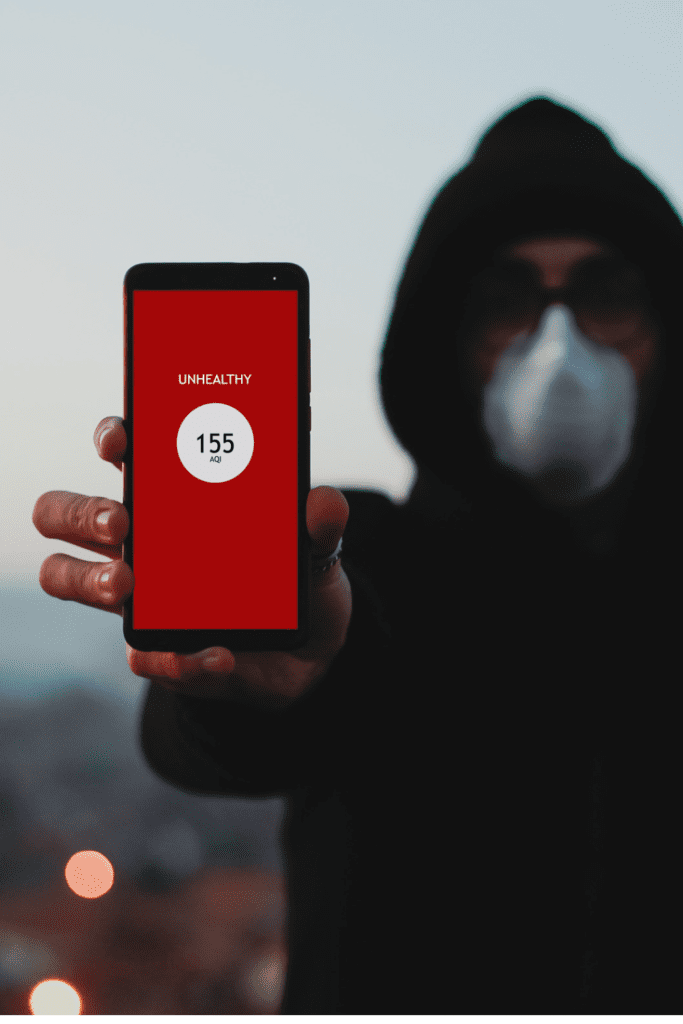
In the U.S., air quality is measured on a scale known as A.Q.I., which stands for Air Quality Index.
Basically, it measures the levels of 5 major air pollutants:
- Ground level ozone (O3)
- Carbon monoxide (CO)
- Sulfur Dioxide (SO2)
- Nitrogen Dioxide (NO2)
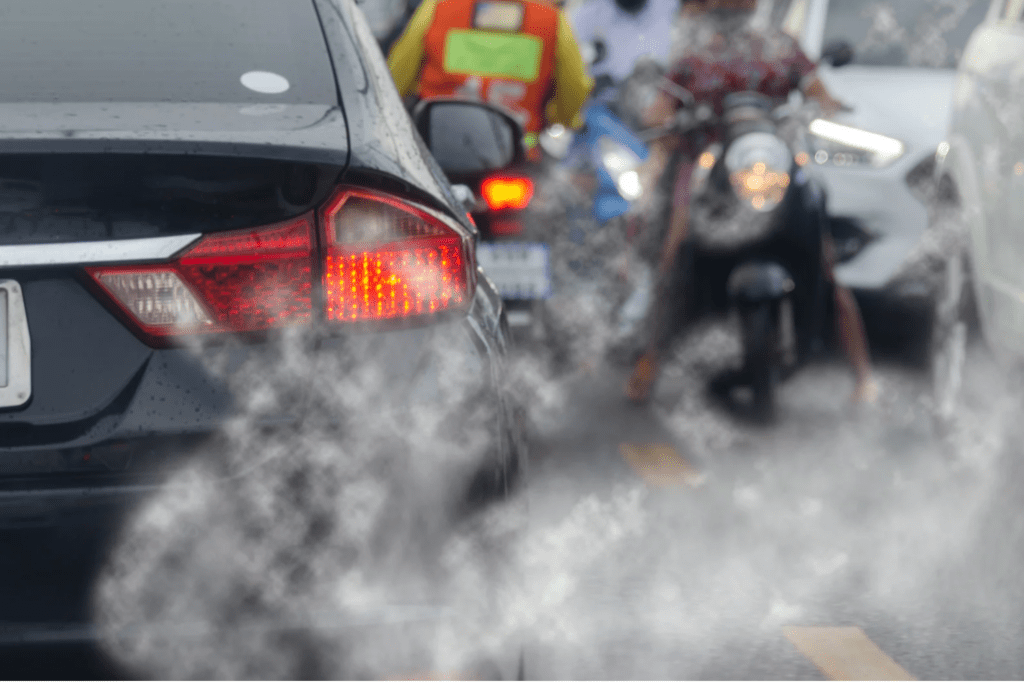
- Airborne particles (also called Particulate Matter or PM), like soot, smoke, etc.
The Environmental Protection Agency (E.P.A.) determines which air pollutants get monitored (and which are completely ignored) and set the standards for “acceptable” levels of each. Notice that the A.Q.I. doesn’t monitor daily lead levels in the air, even though the heavy metal is categorized as a criteria air pollutant. Instead, the EPA collects and distributes data on lead in the air on a rolling 3-month average.
The A.Q.I. does not take into account 9 other major air pollutants, such as benzene, asbestos and creosote, many of which are known human carcinogens.
What is the Air Quality Index (A.Q.I.) Used For?
The Air Quality Index is used by states to forecast the air quality for the next day.
The scale has a range of 0-500, with a level of 50 or below registering as “good” air (posing little to no threat to human health), while anywhere from 301-500 is considered hazardous to human health.
“air-quality-index” by California Air Resources Board is licensed under CC BY 2.0
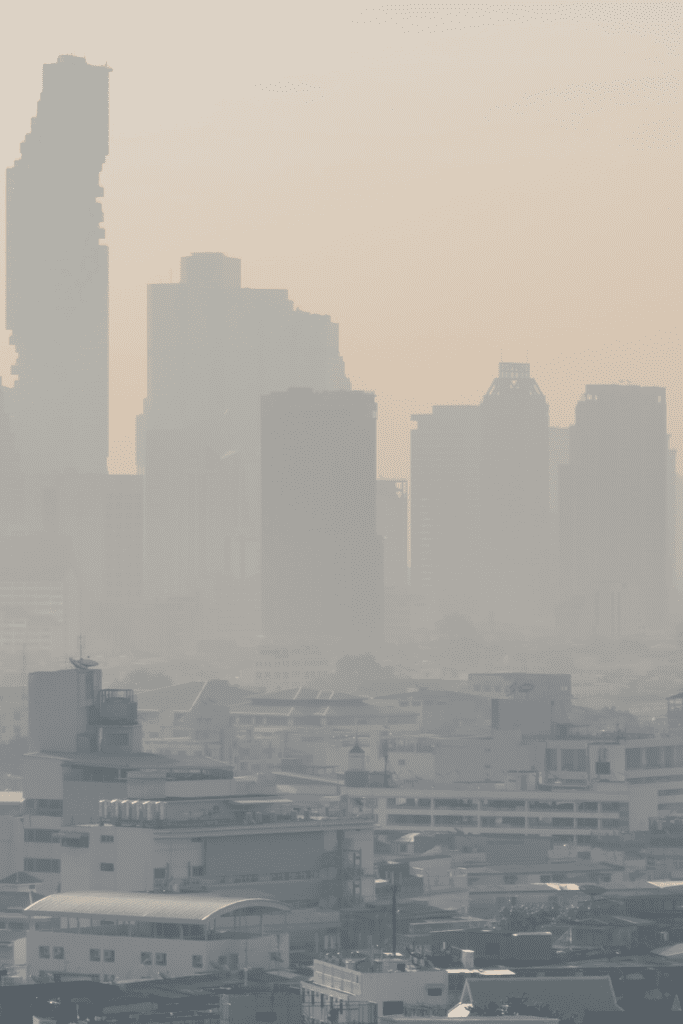
The stark contrast between the outdoor samples taken from Asheville, NC and Los Angeles, CA visually display the depletion of air quality due to the addition of smoke and soot in the air during the week of September 14th, 2020.
Free, Bilingual Air Quality Experiment Printable
For a free, downloadable lesson for this activity, written in both English and Spanish, click on the buttons below! Spanish translation courtesy of @gogreenfortheocean.
Thank You to Our Science Volunteers!
A huge thank you goes to all of the volunteers for this project:
@asmalllife, @honestlymodern, @from_scratch_nutrition, @justtemple, @alysia.ehle, @happytohealthyou and @vyolivan.