
How to Create Critical Thinkers by Freezing Water: A Science Experiment
Creating critical thinkers can be done with little more than water, food coloring, and a below-freezing temperature! Learn how freezing water can become a science experiment in this simple investigation.
The other day, my nine-year-old daughter asked me if the color of water would affect its freezing point. I asked her what she thought the answer was, and she said that because darker colors absorb heat better than lighter ones, she assumed that dark-colored water would freeze at a lower temperature than light-colored water.
I suggested that she get some food coloring and test her hypothesis! Although I knew that the addition of food coloring wouldn’t change the freezing point of water, I realized that this would be an excellent opportunity for her to design, test, and analyze her very own experiment. Nurturing her confidence in carrying out the scientific method from start to finish was a fundamental part of her education, so we quickly gathered our supplies and she got started!
Experimenting with Freezing Water
From this simple experiment, your learners can (with a bit of guidance depending on ability level):
- Form a hypothesis
- Discuss background information
- Create a materials list
- Write step-by-step instructions to conduct the experiment
- Collect data
- Visualize data with the creation of a graph
- Analyze the data
- Form a conclusion based on the data collected
Learning how to properly design, conduct, and analyze an experiment takes time. We did this activity in two days. The first was spent on designing and conducting the experiment, the second was devoted to graphing the data, analyzing the results, and drawing conclusions. Depending on the ability level of your learners, and the time you have to devote to this lesson, it is perfectly appropriate to spread the learning out over a week.
To give you an example to work from, here is what my daughter chose to do:
Asking a Question and Forming a Hypothesis
The question my daughter asked was, “Does the color of water affect its freezing point?”.
Using her background knowledge of heat absorption and colors, she determined that a plausible answer to the question would be yes because darker colors absorb more heat than lighter colors. This is also known as her hypothesis, as it is an educated guess as to the outcome of the experiment.
Your learners may choose a different question, such as “Does the container the water is held in effect its freezing point?” or “Does the volume of water affect its freezing point?” – any question that has one variable will work well for this experiment!
Discussing Background Information
Being familiar with the freezing point of water is a key element in this experiment. Discuss with your learner that water freezes at 0℃ or 32℉. Temperatures above freezing point will cause a phase change from solid to liquid water, and temperatures below freezing point will do the reverse.
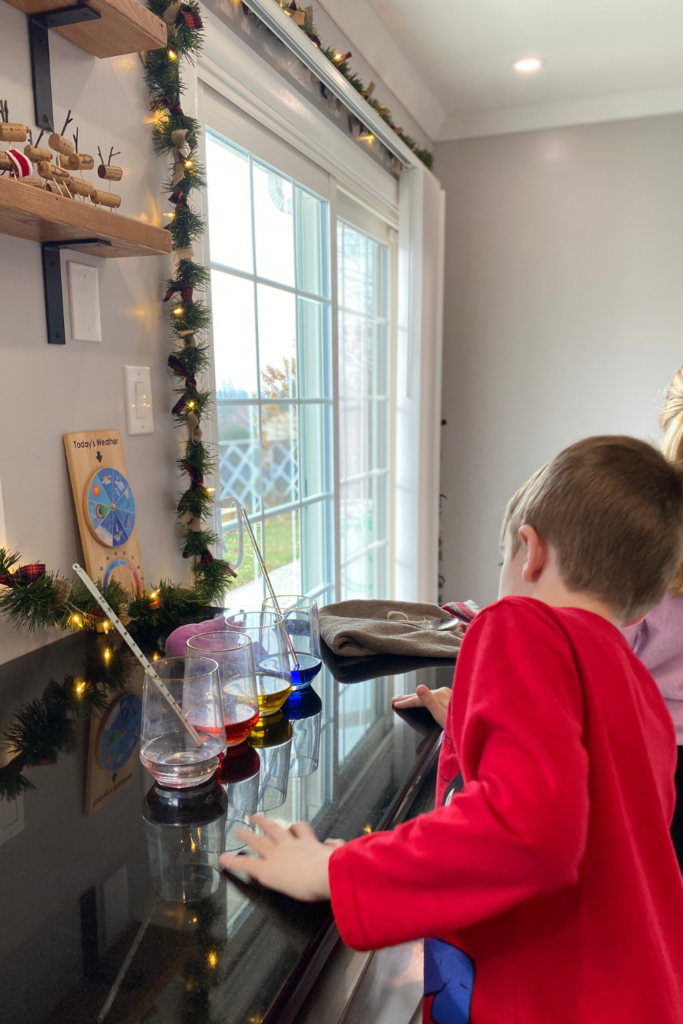
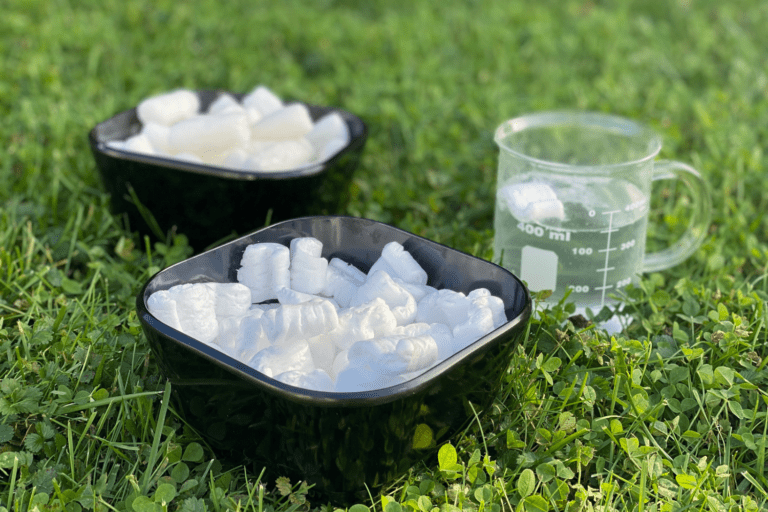
We happen to live in a seasonal climate where winters dip below freezing on a regular basis, which is why we chose to conduct this experiment outside. However, this experiment could easily be done in a freezer, so long as the temperature is adjusted to be a few degrees below the freezing point of water, to allow for a more gradual phase change from liquid to solid.
Creating a Materials List for the Experiment
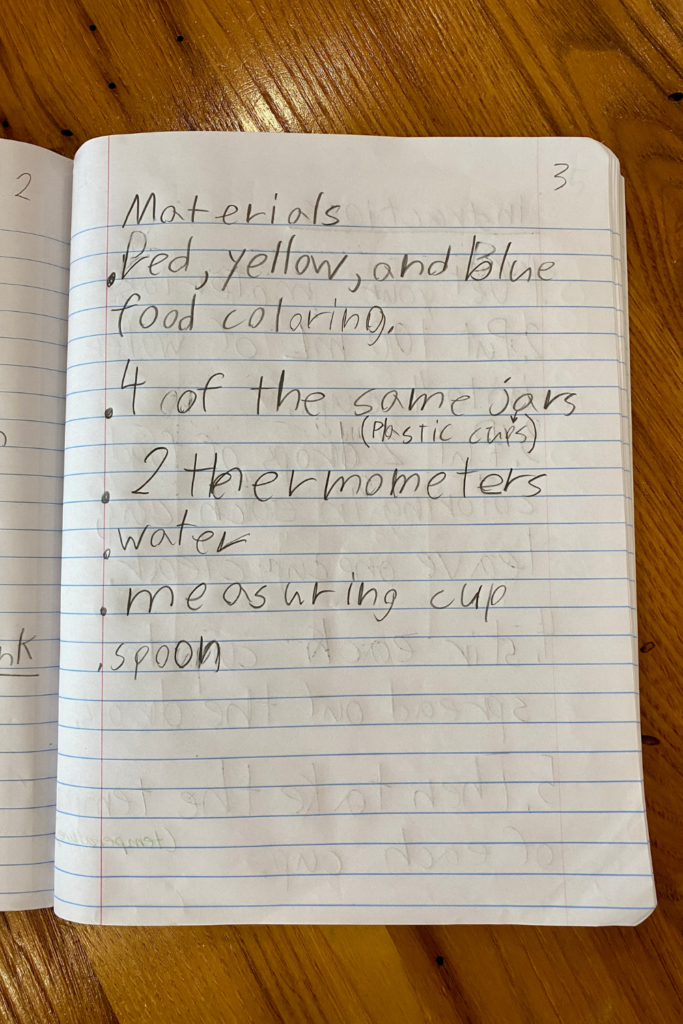
Now it’s time for your learner to get to work. Have them collect the materials that they will need and place them in the designated workspace, then write a list of the necessary items in their science journal. Here is what my daughter chose to use for her freezing water experiment:
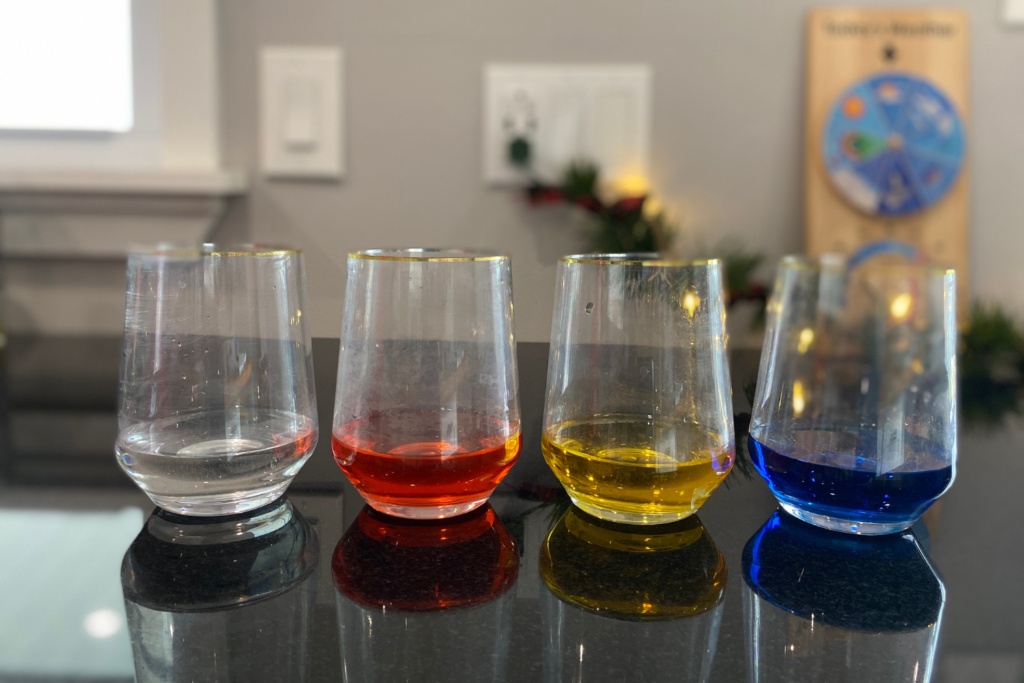
- Red, yellow, and blue food coloring
- 4 plastic cups*
- Thermometer
- Water
- Measuring cup
- Spoon
*my daughter originally wrote that she would use 4 jars until we discussed that thin glass jars could potentially crack when water was frozen in them, so she switched to using clear, plastic drinking cups.
Designing the Instructions for the Freezing Water Experiment
Writing instructions challenges even the brightest of students, because writing clear, concise directions is a skill that requires a lot of practice. If possible, allow students to verbalize their instructions to you or to a partner to help them clarify their meaning and add in any missing steps. Students may find they need to revisit and edit their materials list once they’ve created their instructions, as additional items may be needed to experiment!
Here is the final list of instructions my daughter created to conduct her freezing water experiment:
- Get your materials.
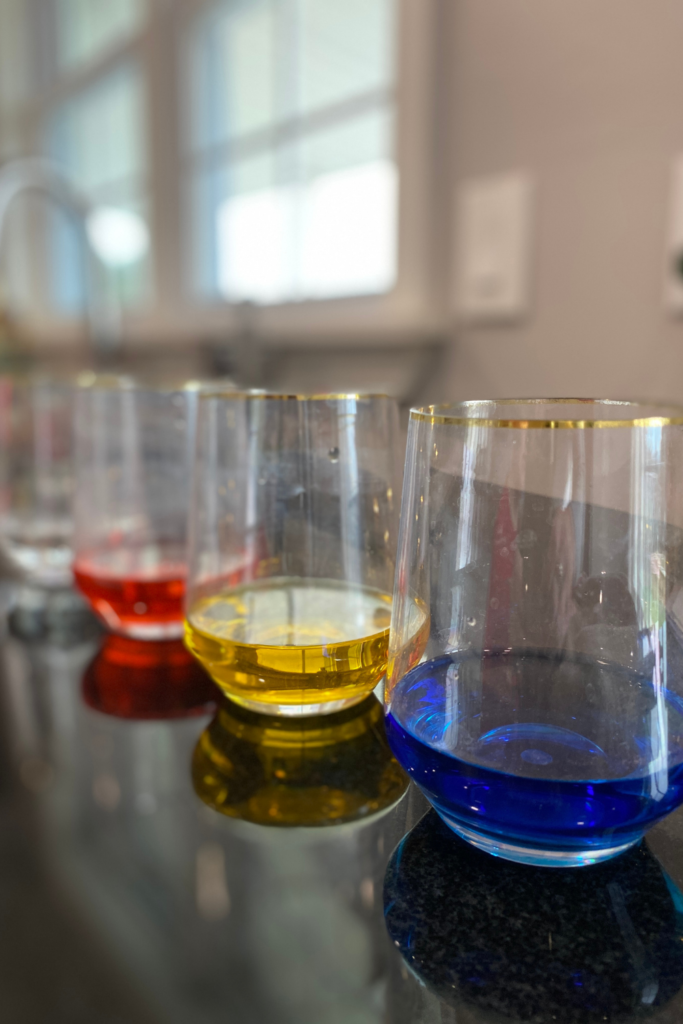
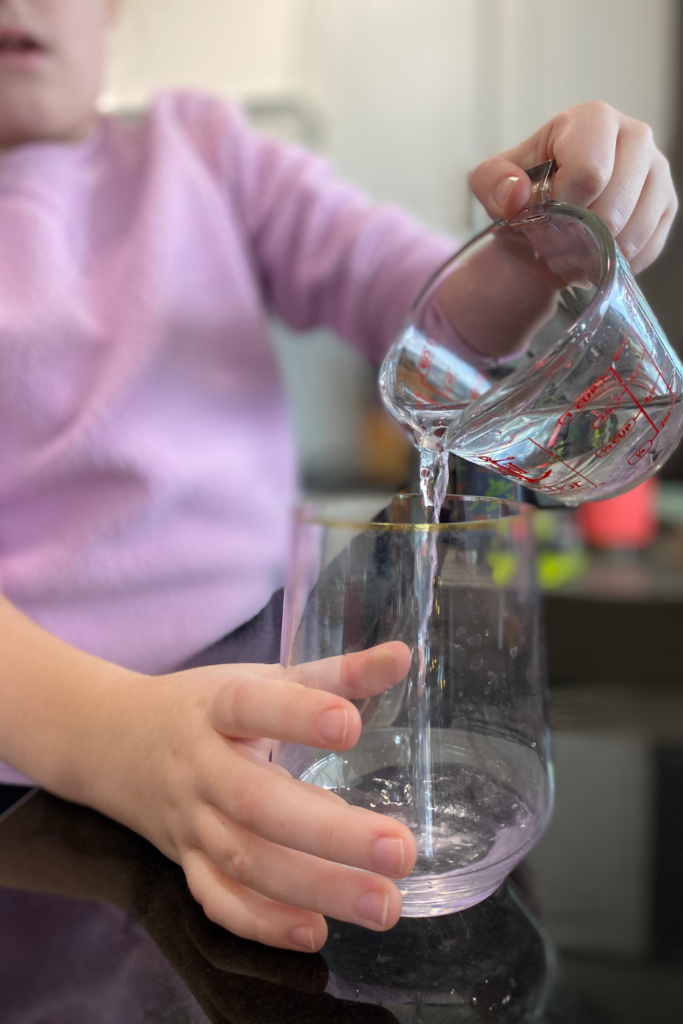
- Put 100 mL of water into four cups.
- Put two drops of food coloring into each cup of water; leave one cup clear.
- Stir each cup to spread out the food coloring drops.
- Take the starting temperature of each cup and record.
- Place the four cups outside.
- Set a timer for 10 minutes.
- Every 10 minutes, check until they are frozen.
Designing instructions is a great time to have a conversation about controls and variables. In my daughter’s experiment, she chose to have one cup without food coloring, which served as her control. The only variable, or the factor that changed, was the food dye color difference added to the three remaining cups.
Collecting Scientific Data
Before my daughter began to collect data for her freezing water experiment, she created a simple table to record her information. We have a thermometer that measures temperature in Celcius, so that is the measurement she recorded every 10 minutes. She planned to collect data until each cup reached 0℃.
That being said, temperature collection is not necessary to complete this experiment. I wanted my daughter to collect data to practice her graphing skills. For younger learners, this could be used instead as a qualitative observational experiment, where learners watch to see when the cups begin to form ice inside.
Here is an example of the data collection table we used:
| Time (minutes) | Clear Cup (℃) | Red Cup (℃) | Yellow Cup (℃) | Blue Cup (℃) |
| 0 | ||||
| 10 | ||||
| 20 | ||||
| 30 | ||||
| 40 | ||||
| 50 | ||||
| 60 | ||||
| 70 | ||||
| 80 |
During the data collection phase of this experiment, my daughter quickly realized that measuring the temperature of each cup every ten minutes was quite a chore! I told her to make a note of that in her science journal, as a reminder for the next time she designed an experiment that had time as a factor.
Visualizing Scientific Data with a Graph
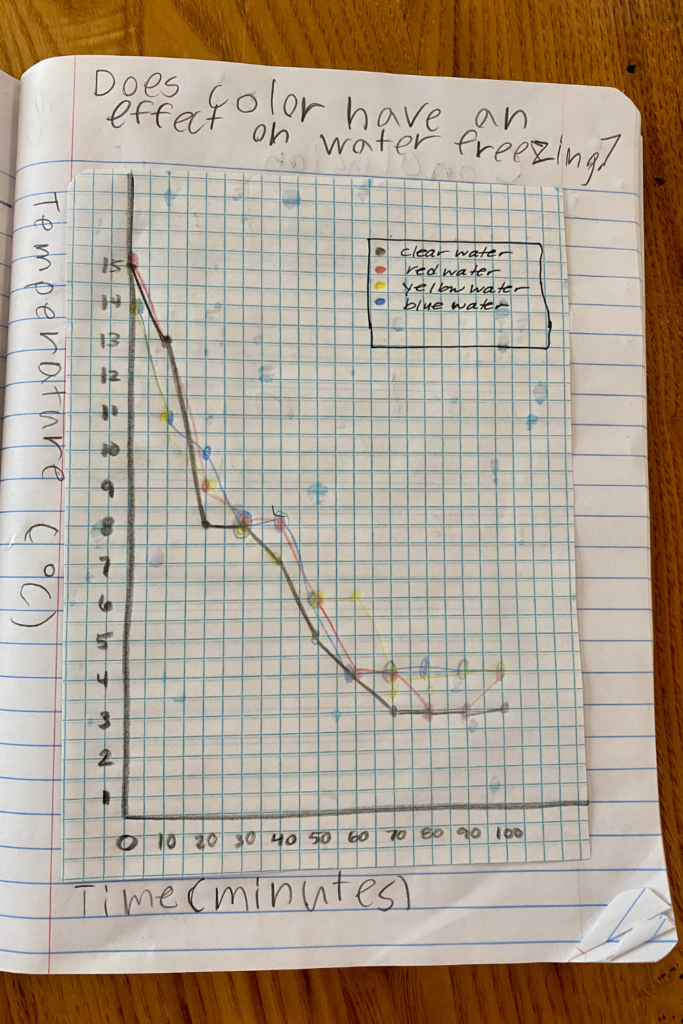
Temperature was the measurement we recorded to determine if the color of water affected its freezing point. Since the temperature was collected at even time intervals, a line graph is an appropriate way to visualize the information. Remember to point out the following things when helping your learner create their graph:
- The x-axis is at the bottom of the graph and will display time, or the independent variable.
- The y-axis is on the left vertical side of the graph and will display temperature, or the dependent variable.
- Label each axis in even increments and include the unit of measurement in the axis title.
- Draw a clear dot to represent each data point
- Connect the data points for each colored cup like you would connect dots on a picture.
- Include a key to help explain the data.
- Create a title for the graph that highlights what the graph is visualizing.
Again, depending on the age and ability level of your learner, you may choose to only demonstrate how to graph the data, or set up the graph and allow the student to plot their information. Or skip this step altogether and verbally discuss the results of the freezing water experiment!
Drawing Conclusions from the Freezing Water Experiment
This is one of the best parts of any science experiment – discovering if your prediction was accurate! Make sure to stress to your learners that making a correct prediction is not the goal of the experiment; learning from the experiment is!
For my daughter’s experiment, she concluded that adding food coloring to water didn’t affect the freezing point. She then went on to talk about other things she could try to change the freezing point of water, like adding salt to the water. I think she may have remembered a lesson I taught with Medinah of Science Teacher Mom that looked at why we add salt to roads in the winter!
You may notice that once your student understands the process of designing and conducting an experiment, they’ll want to experiment over and over again. I’d count that as a win!
Making Science Easily Accessible
Conducting simple scientific experiments like this one allows students to see that science is everywhere and doesn’t require fancy equipment to conduct investigations. Additionally, their confidence in making predictions and interpreting information will grow, strengthening their critical thinking skills.
If you try this freezing water experiment, please let me know by tagging me @thoughtfullysustainable on Instagram or Facebook, or by leaving a comment below! If you have any questions, feel free to email me!

One Comment
Comments are closed.